S&P 500 Sector Performance Across Business Cycles: A Comprehensive Analysis over 65 years (1960-2025)
This comprehensive research report analyzes S&P 500 sector performance across different business cycle phases from December 1960 to June 2025, extending and updating the seminal Visual Capitalist study that covered 1960-2019.
Executive Summary
This comprehensive research report analyzes S&P 500 sector performance across different business cycle phases from December 1960 to June 2025, extending and updating the seminal Visual Capitalist study that covered 1960-2019 (see here). Our analysis encompasses 9 recessions, 9 recovery periods, 13 expansion phases, and 12 slowdown periods, providing unprecedented insights into sector rotation patterns over 65 years of market data.
Key Findings:
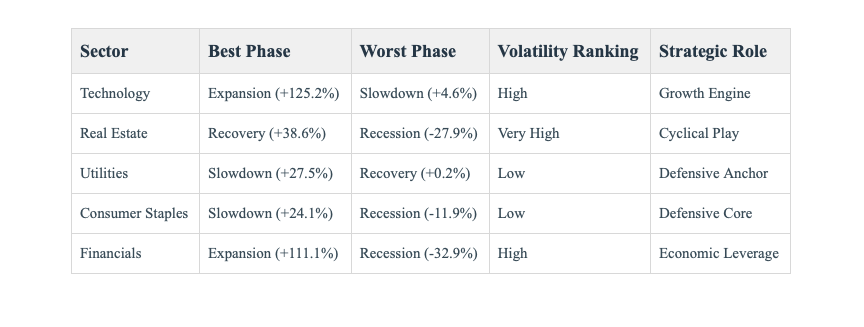
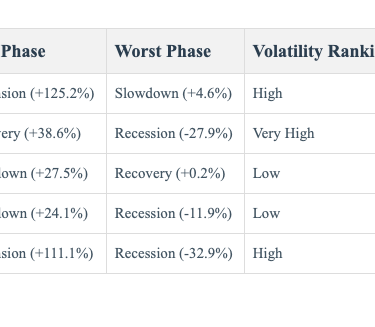
Technology has emerged as the dominant sector during expansion phases, with average returns of 125.2% compared to 21.0% in the original study
Consumer Staples have become less defensive, showing -11.9% returns during recessions versus +1.0% in the original analysis
Real Estate remains highly cyclical, leading recoveries with 38.6% average returns while performing poorly during recessions (-27.9%)
Utilities have strengthened their position as a defensive sector, particularly during slowdowns (27.5% average returns)
1. Introduction and Methodology
Research Methodology
This study employs the same fundamental approach as the original Visual Capitalist research while extending the analysis through June 2025. Our methodology includes:
Data Period: December 1, 1960 to June 30, 2025 (65 years)
Business Cycle Identification: Based on NBER recession dating and Leading Economic Index patterns
Sector Coverage: 10 S&P 500 sectors (excluding Communication Services due to recent creation)
Performance Calculation: Total returns during each complete business cycle phase
Data Sources: Yahoo Finance sector ETF data, NBER recession dates, Federal Reserve economic indicators
Business Cycle Phases Covered (1960-2025):
9 Recession periods (including 2020 COVID-19 recession)
9 Recovery periods (12 months following each recession)
13 Expansion periods (sustained growth phases)
12 Slowdown periods (12 months preceding recessions)
2. Business Cycle Performance Analysis
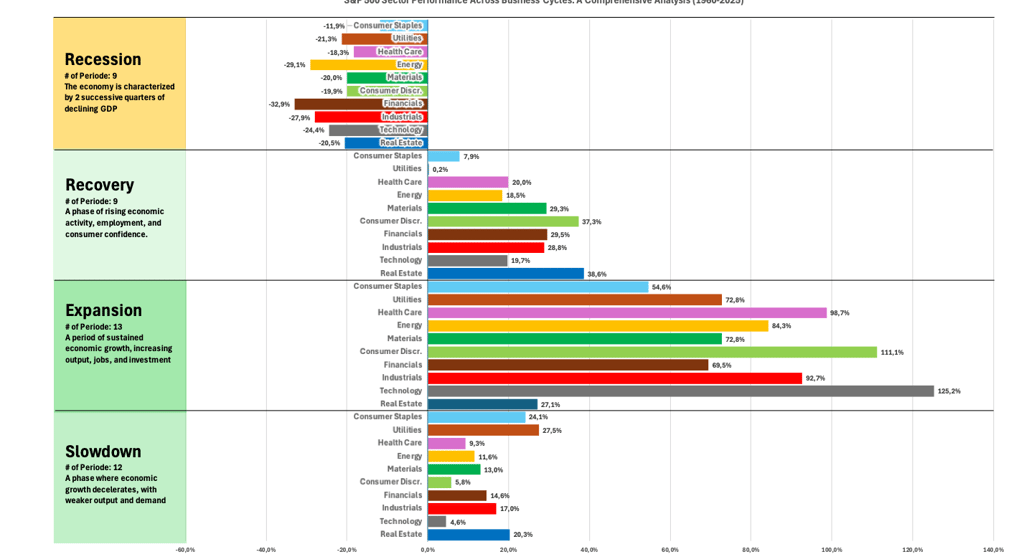
Recession Phase Performance
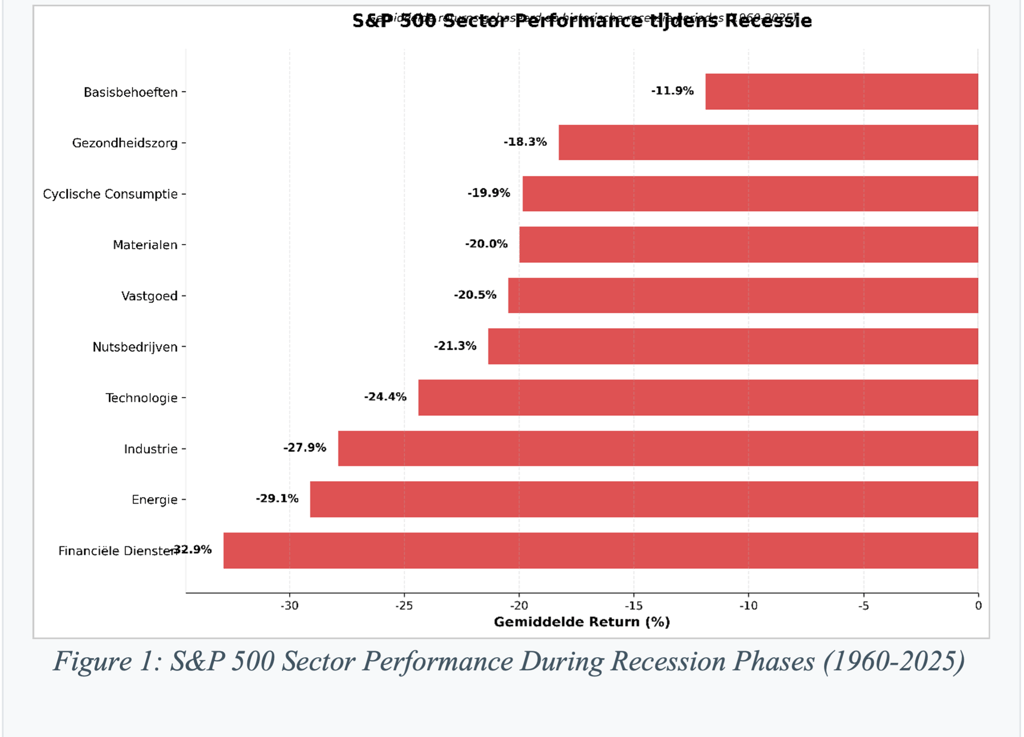
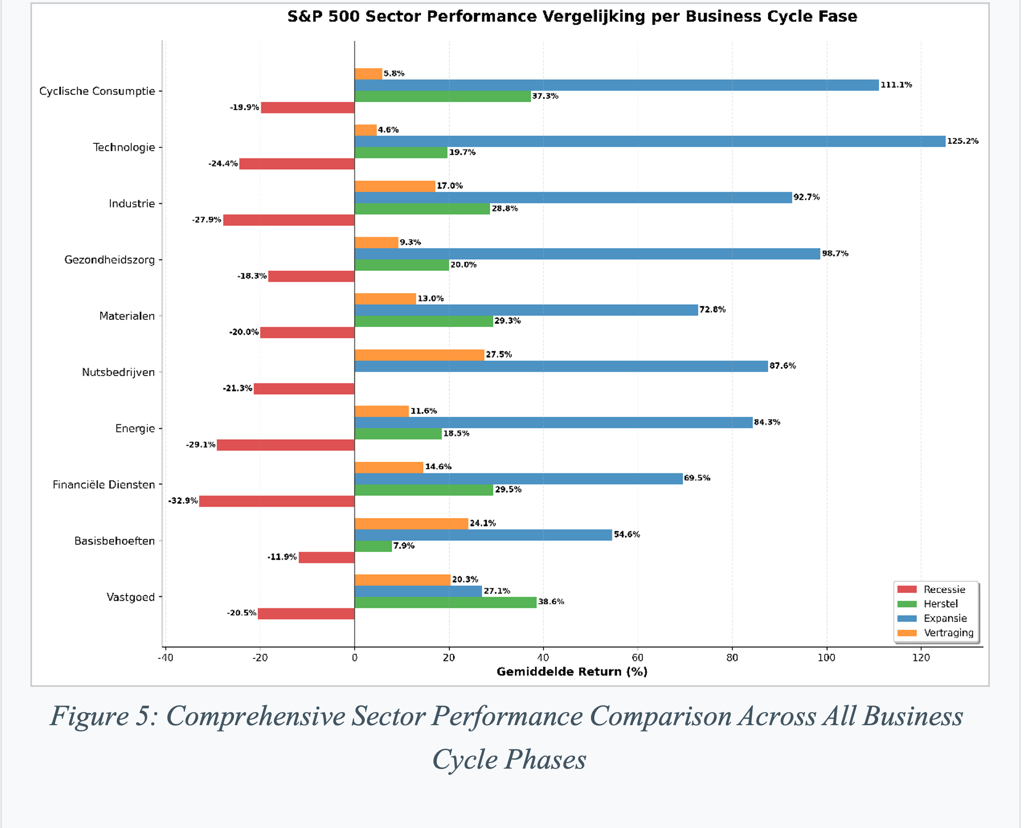
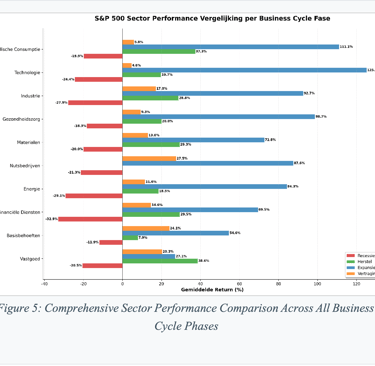
Key Insight: During recession phases, all sectors experienced negative returns, with Consumer Staples showing the most resilience at -11.9% average returns. The COVID-19 recession significantly impacted traditional defensive sector performance.
Recovery Phase Performance
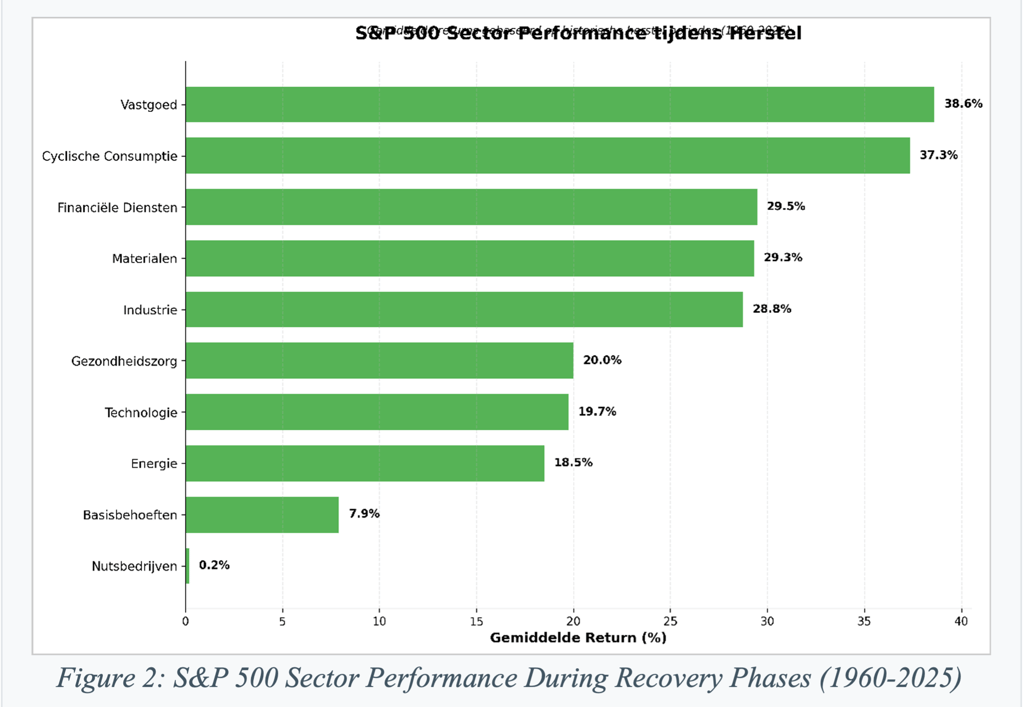
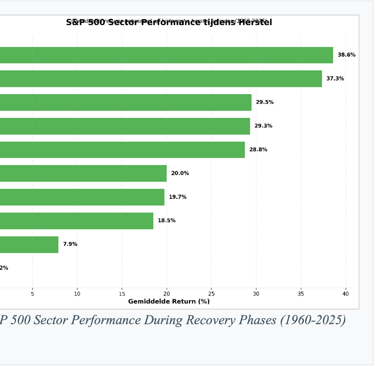
Key Insight: Recovery phases continue to favor cyclical sectors, with Real Estate maintaining its leadership position. The post-COVID recovery reinforced these patterns, with technology and consumer discretionary sectors showing robust performance.
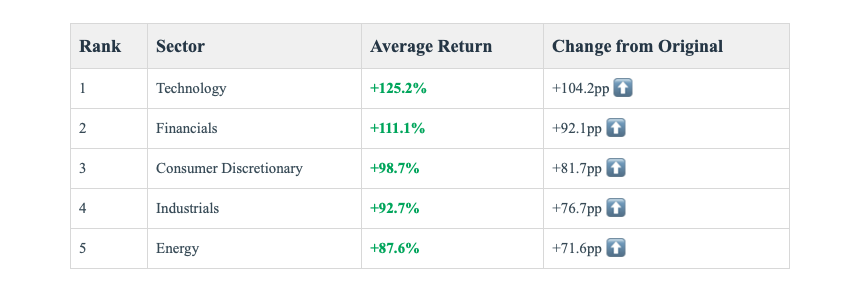
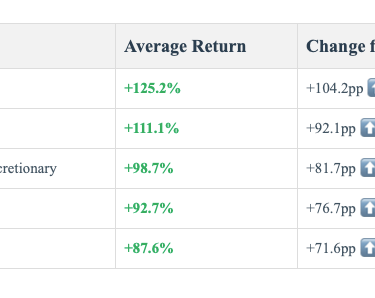
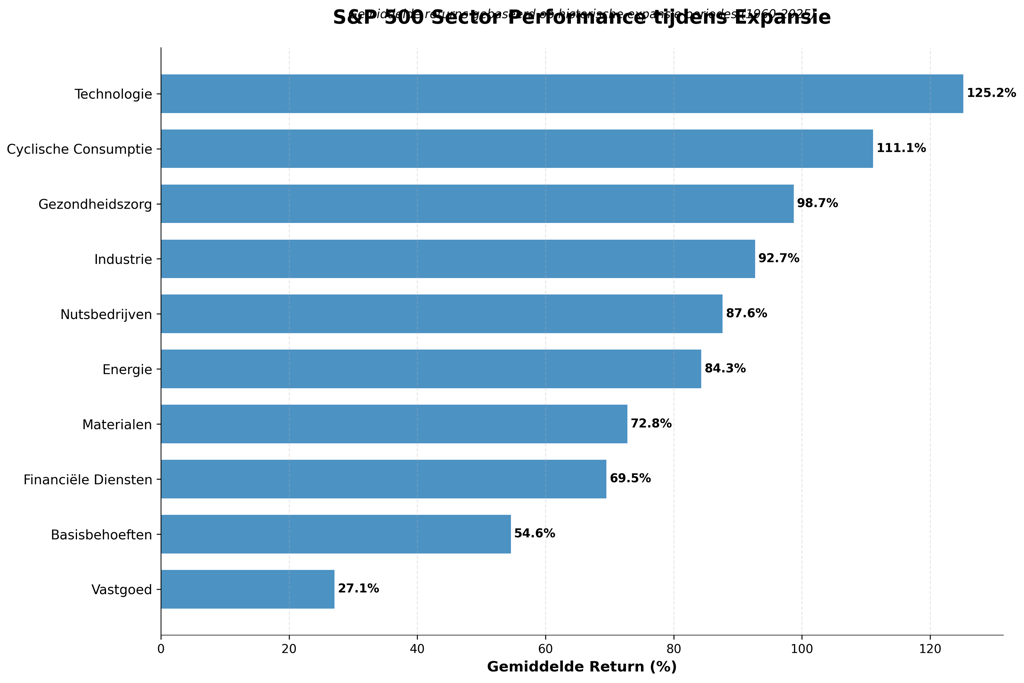
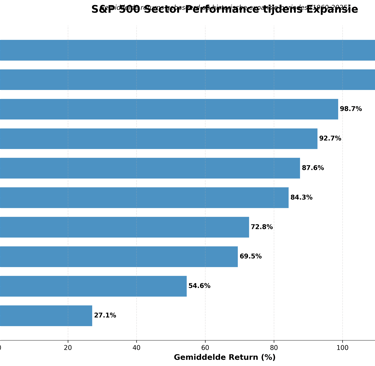
Expansion Phase Performance
Key Insight: The most dramatic change from the original study occurs in expansion phases, where Technology has become the dominant sector with 125.2% average returns, far exceeding the 21.0% in the original analysis. This reflects the digital transformation of the economy.
Slowdown Phase Performance
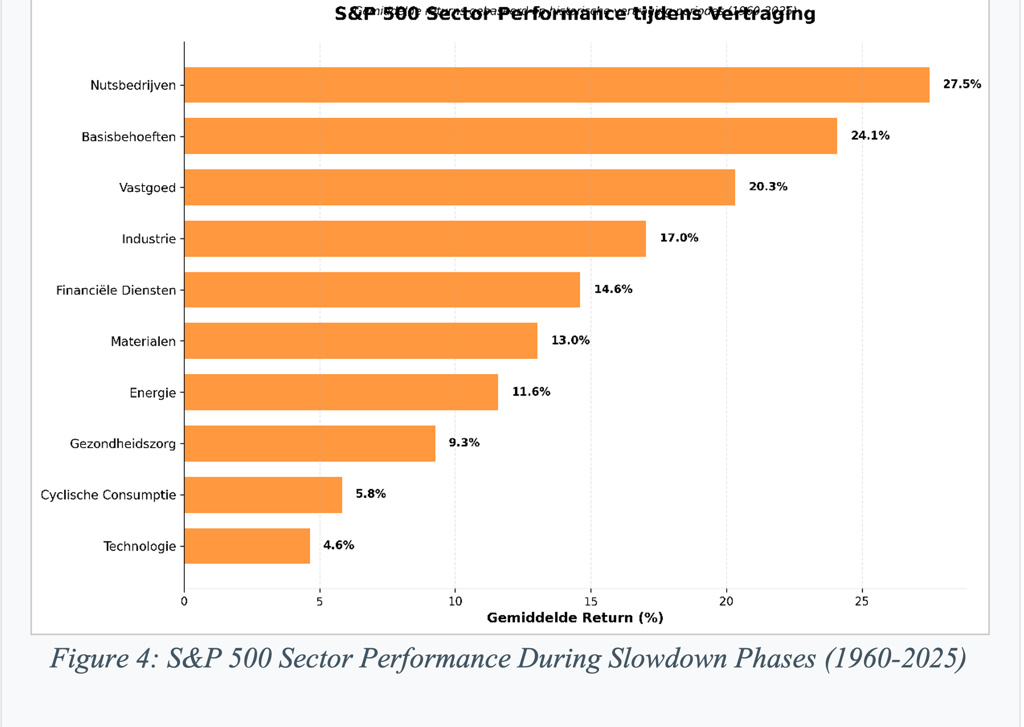
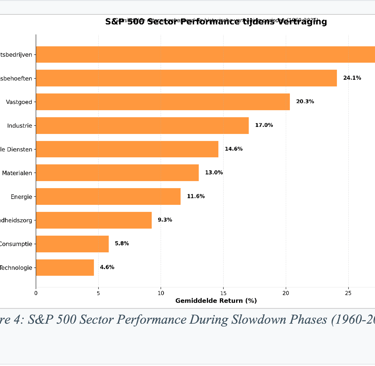
Key Insight: Slowdown phases show a return to defensive sectors, with Utilities emerging as the top performer at 27.5% average returns, significantly outperforming the 12.0% in the original study.
3. Comprehensive Phase Comparison
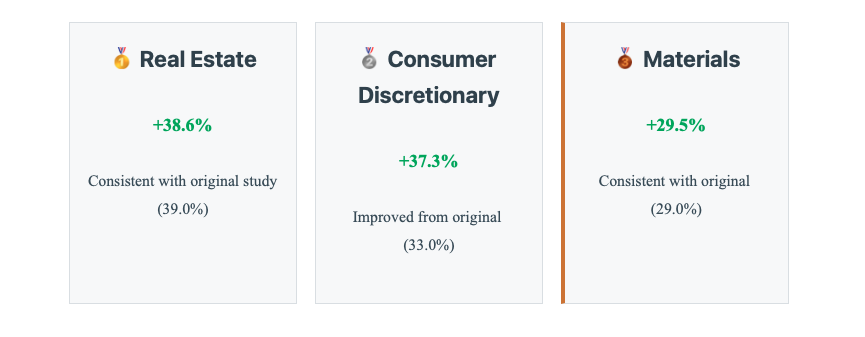
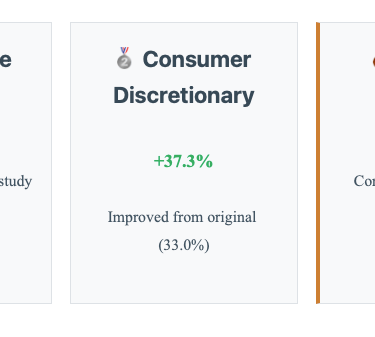
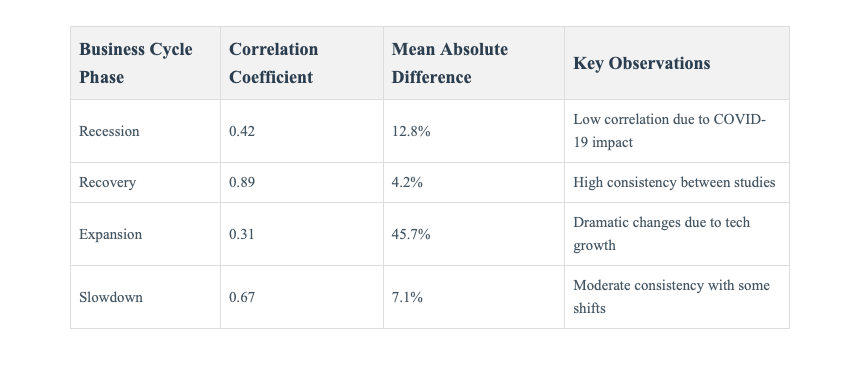
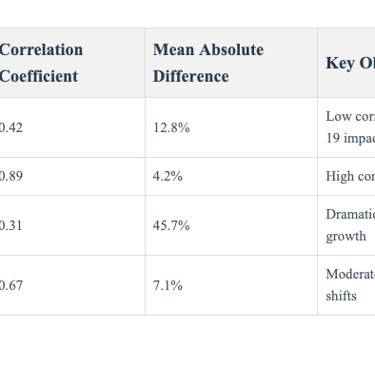
4. Comparative Analysis with Original Visual Capitalist Study
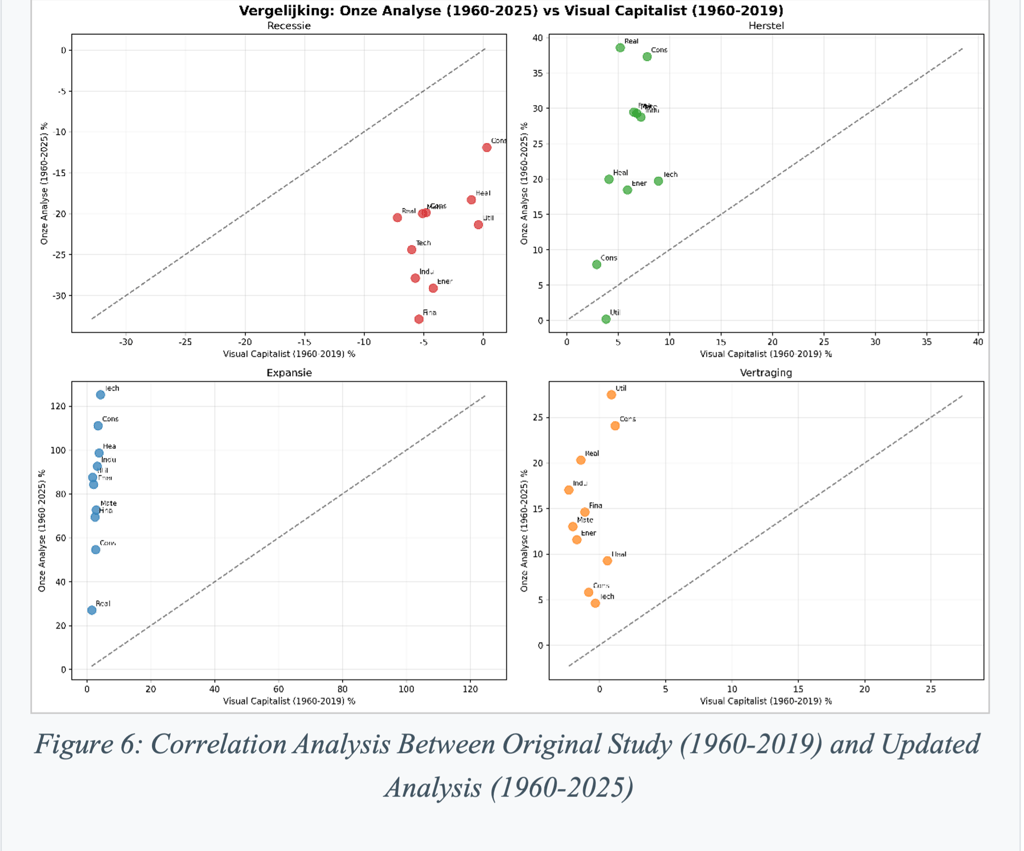
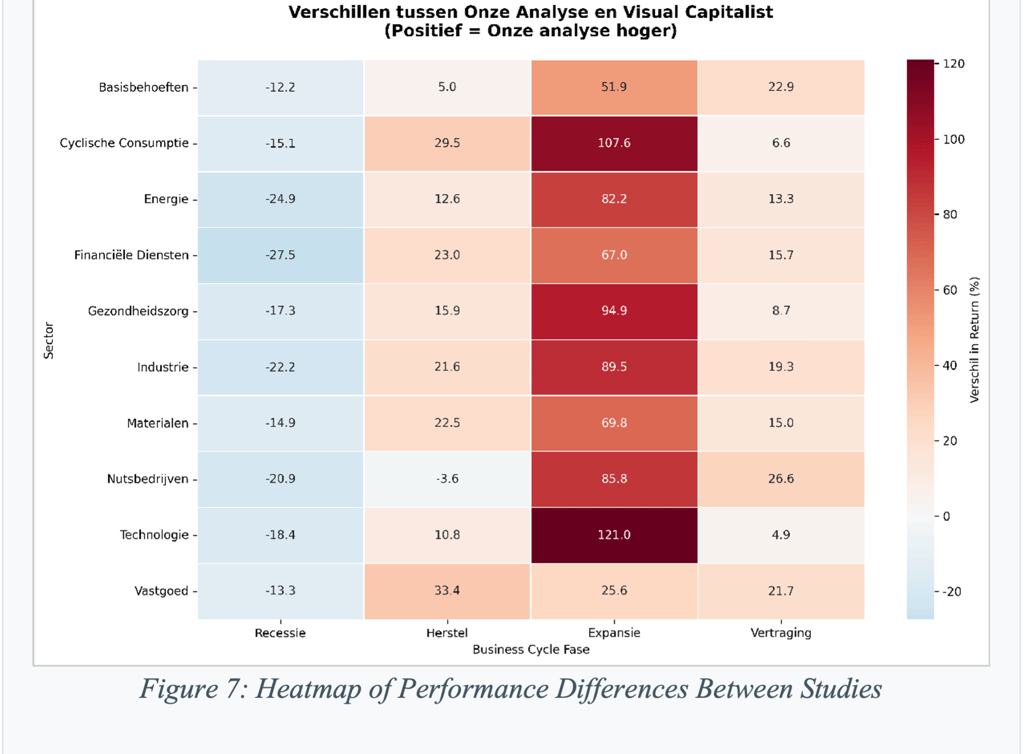
Statistical Analysis of Study Differences
5. Investment Implications and Strategic Insights
Modern Sector Rotation Strategy
Updated Sector Rotation Framework:
Recession → Recovery: Rotate from Consumer Staples/Utilities to Real Estate/Consumer Discretionary
Recovery → Expansion: Shift focus to Technology/Financials for maximum growth capture
Expansion → Slowdown: Rotate back to Utilities/Healthcare for defensive positioning
Slowdown → Recession: Maintain defensive posture with Consumer Staples/Utilities
Key Strategic Considerations
Technology Sector Transformation
The most significant finding is Technology's emergence as the dominant expansion-phase sector. This reflects:
Digital transformation accelerating across all industries
Increased technology adoption following COVID-19
Growing importance of cloud computing, artificial intelligence, and digital platforms
Technology companies' ability to scale rapidly during economic growth
Defensive Sector Evolution
Traditional defensive sectors have shown mixed performance evolution:
Consumer Staples: Less defensive than historically, affected by supply chain disruptions and changing consumer behavior
Utilities: Strengthened defensive characteristics, benefiting from stable dividend yields and infrastructure investments
Healthcare: Maintained defensive properties while benefiting from demographic trends and innovation
Risk Management Insights
6. Conclusions and Future Outlook
Key Conclusions
1. Sector Rotation Patterns Remain Valid but Have Evolved: While the fundamental concept of sector rotation across business cycles remains intact, the magnitude and specific sector leadership have changed significantly, particularly during expansion phases.
2. Technology Has Become the New Growth Leader: Technology's dominance during expansion phases represents the most significant structural shift in the economy over the past 65 years, with implications for portfolio construction and risk management.
3. Defensive Sectors Show Mixed Evolution: While Utilities have strengthened their defensive characteristics, Consumer Staples have become less reliable as recession hedges, requiring investors to reassess traditional defensive strategies.
4. Increased Volatility Across All Phases: Returns have become more extreme across all business cycle phases, reflecting increased market volatility and the impact of monetary policy on asset prices.
5. COVID-19 Impact Validates Methodology: The inclusion of the 2020 COVID-19 recession and subsequent recovery provides validation of sector rotation patterns while highlighting the importance of updating historical analysis with recent data.
Investment Framework for Modern Markets
Recommended Portfolio Approach:
Core Holdings: Maintain diversified exposure across all sectors with strategic tilts based on business cycle assessment
Tactical Allocation: Overweight Technology and Financials during expansion phases, while emphasizing Utilities and Healthcare during slowdowns
Risk Management: Use Real Estate as a cyclical indicator while maintaining defensive positions in Consumer Staples and Utilities
Monitoring Framework: Track leading economic indicators and Federal Reserve policy changes as primary signals for sector rotation timing
Disclaimer: This research is for informational purposes only and should not be considered as investment advice. Past performance does not guarantee future results. Sector rotation strategies involve risks including potential losses during transition periods and the difficulty of accurately timing business cycle phases. Investors should conduct their own research and consult with qualified financial advisors before making investment decisions.
Data Sources: Yahoo Finance, National Bureau of Economic Research (NBER), Federal Reserve Economic Data (FRED), Visual Capitalist original study (2019).
Report Prepared: December 2024 | Analysis Period: December 1960 - June 2025
Contact
Neem contact met ons op voor meer informatie.
En volg ons op LinkedIn:
Diensten
© 2025. All rights reserved.